Measuring bath properties using the STARprobeTM
Marc Dupuis1, Jean-Pierre Gagné2and Pierre Bouchard2
1. GeniSim Inc,
2. STAS
Corresponding author: marc.dupuis@genisim.com
Abstract
Since the beginning of 2012, STAS is the world distributor of the STARprobeTM developed by
Alcoa [1, 2]. Demonstration measurement campaigns have been conducted in different smelters
around the world.
During those campaigns, the STARprobeTM bath properties measurements have been compared
with standard bath properties measurements regularly carried out in those smelters operated by
different aluminium producers.
Those independent comparative measurements all confirmed the capacity of the STARprobeTM
to instantaneously and accurately measure Superheat, Temperature, Alumina concentration and
bath Ratio for cell control purposes.
Keywords: STARprobeTM, cell control, XRD bath analysis, alumina concentration, superheat,
temperature, bath ratio, measurements
1.
Introduction
The STARprobeTM is a portable device that takes real-time measurements of bath properties,
such as Superheat, Temperature, Alumina concentration and bath Ratio or acidity (STAR), in
electrolysis cells. This synchronicity of measurements is a most important step forward in
improving the control and efficiency of electrolysis cells. It unites the conventional processes of
temperature measurement and bath sampling-analysis into one online measurement, simplifies
and greatly shortens the process and time space from measurement/sampling to pot control
decision. The pot control decision can therefore be based on the real time cell conditions rather
than those from few hours ago or from as long as 24 hours ago.
This integrated real-time measurement system consists of four major components:
•
Reusable probe tip
•
Portable stand to fit various pot configurations
•
Electronics for data acquisition and analysis, and wireless communications for data
transfer
•
Tablet PC with programs to perform all necessary tasks during measurements.
Considering the great advantages of the STARprobeTM, Alcoa has decided to share the
technology with the rest of the aluminium industry starting from 2012. In this regard, Alcoa has
just appointed STAS, a well recognized leader in the aluminium industry (www.stas.com ), to
commercialize the new STARprobeTM analyzing system.
2.
First measurement campaign
The main objective of the first measurement campaign was to get familiar with the
STARprobeTM measurement technique. Since that measurement technique turned out to be
fairly easy to master, we were quickly in position to take advantage of the time set aside to carry
out measurements and try to learn from them.
1
2.1.
First repetitivity test
One big question that is typically set aside when bath samples are taken for bath chemistry
control purposes is how homogeneous is the bath and hence how representative is a small
localized bath sample of the average composition of the bath. Considering the way that the
alumina is discretely added to the bath in one region of the cell and consumed in another region,
there is no reason to expect that the dissolved alumina concentration in the bath should be
relatively homogeneous.
For the first time, using the STARprobeTM, it is possible to quickly measure the dissolved
alumina concentration in the bath in order to try to assess how homogeneous it is in the bath.
For that purpose, 15 consecutive STARprobeTM measurements were carried out in the tap hole
of the same pot over a period of 90 minutes averaging one measurement every 6 minutes. The
obtained results are presented in the Table 1. Figures 1 to 4 highlight the relative variability or
lack of strict repetitivity of the measurements which in turn highlight the lack of homogeneity of
the bath. This is particularly true for the dissolved alumina concentration and the bath superheat
which is directly affected by the dissolved alumina concentration in the bath sample analyzed by
the STARprobeTM. Nevertheless, the averaged results give a very consistent picture of the cell
conditions as the average measured excess AlF3 concentration of 10.69%, the average measured
dissolved alumina concentration of 2.6%, the line average CaF2 concentration of 4.9% and the
measured average bath temperature of 968.72 °C can be used to calculate a bath superheat of
4.97 °C using the Solheim equation [3] while the measured average bath superheat is 4.94 °C.
Position
Excess
Al2O3
Temp
Super
tap
10.25
2.93
969.18
6.21
tap
9.67
2.53
971.02
2.05
tap
10.78
2.85
966.68
6.35
tap
10.51
2.6
970.72
8.8
tap
10.89
2.49
970.16
5.87
tap
10.38
2.13
969.98
2
tap
11.31
2.4
971.18
6.72
tap
10.55
2.76
966.51
5.6
tap
10.2
2.5
970.34
3.8
tap
10.48
2.86
968.13
4.9
tap
11.81
2.12
972.61
5.54
tap
11.37
2.08
967.42
2.67
tap
11.27
2.72
963.65
4.24
tap
9.69
3.21
967.3
4.44
tap
11.26
2.7
965.93
4.98
Mean
10.69466667
2.592
968.7206667
4.944667
Std Dev
0.625446888
0.321696396
2.443067354
1.84237
Table 1: Raw data from the first repetitivity test
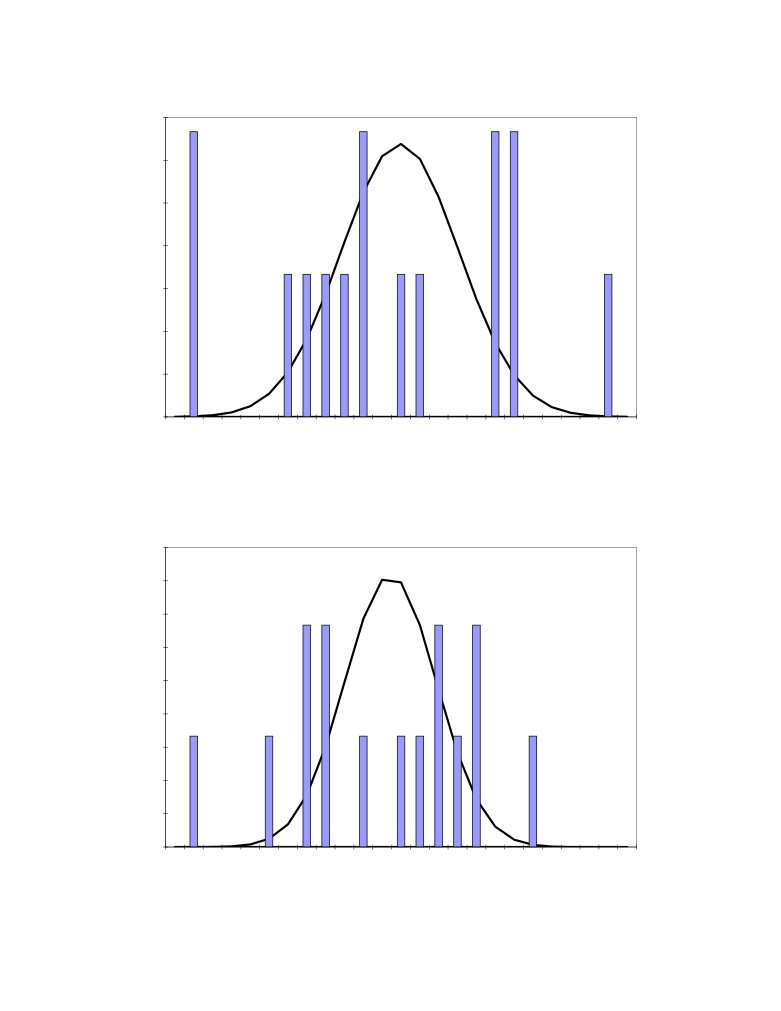
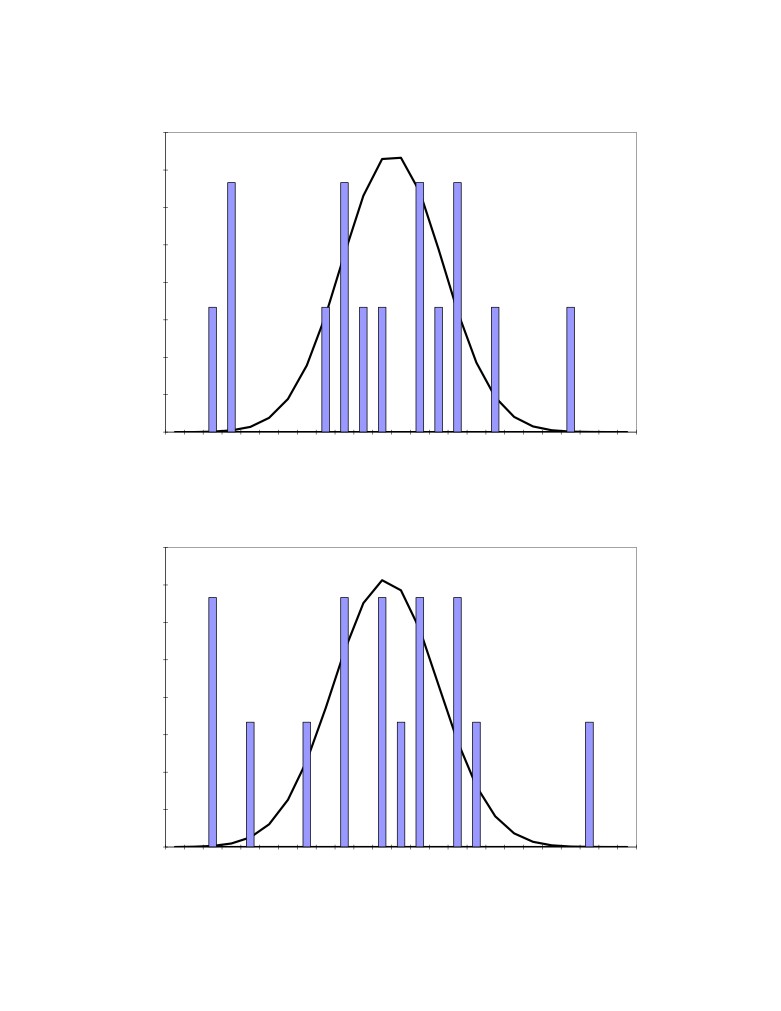
Figure 1 to 4 present the raw distributions (histograms) of the 15 measurements and the
corresponding normal distributions (curves) having the same mean and standard deviation as the
raw distributions.
2
0.14
0.12
0.1
0.08
0.06
0.04
0.02
0
9.6
9.7
9.8
9.9
10
10.1 10.2 10.3 10.4 10.5 10.6 10.7 10.8 10.9
11
11.1 11.2 11.3 11.4 11.5 11.6 11.7 11.8 11.9
12
Measured excess AlF3 concentration %
Figure 1: Distribution of the 15 measured excess AlF3 concentration
0.18
0.16
0.14
0.12
0.1
0.08
0.06
0.04
0.02
0
964
964
965
965
966
966
967
967
968
968
969
969
970
970
971
971
972
972
973
973
974
974
975
975
976
Measued bath temperature °C
Figure 2: Distribution of the 15 measured bath temperature
3
0.16
0.14
0.12
0.1
0.08
0.06
0.04
0.02
0
1.96 2.02 2.08 2.14
2.2
2.26 2.32 2.38 2.44
2.5
2.56 2.62 2.68 2.74
2.8
2.86 2.92 2.98 3.04
3.1
3.16 3.22 3.28 3.34
3.4
Measured dissolved alumina concentration %
Figure 3: Distribution of the 15 measured dissolved alumina concentration
0.16
0.14
0.12
0.1
0.08
0.06
0.04
0.02
0
1.58 1.91 2.24 2.57
2.9
3.23 3.56 3.89 4.22 4.55 4.88 5.21 5.54 5.87
6.2
6.53 6.86 7.19 7.52 7.85 8.18 8.51 8.84 9.17
9.5
Measued bath superheat °C
Figure 4: Distribution of the 15 measured bath superheat
4
2.2.
Second repetitivity test
In order to ensure that the above results are really typical, a second repetitivity test was
performed the next day again repeating STARprobeTM measurements in a single cell. In total, 22
measurements were obtained over the same period of 90 minutes averaging 4 minutes per
measurement. The bath samples were taken this time in two different locations, the taping hole
and in a hole opened for that purpose in the side channel quite far from the tapping hole.
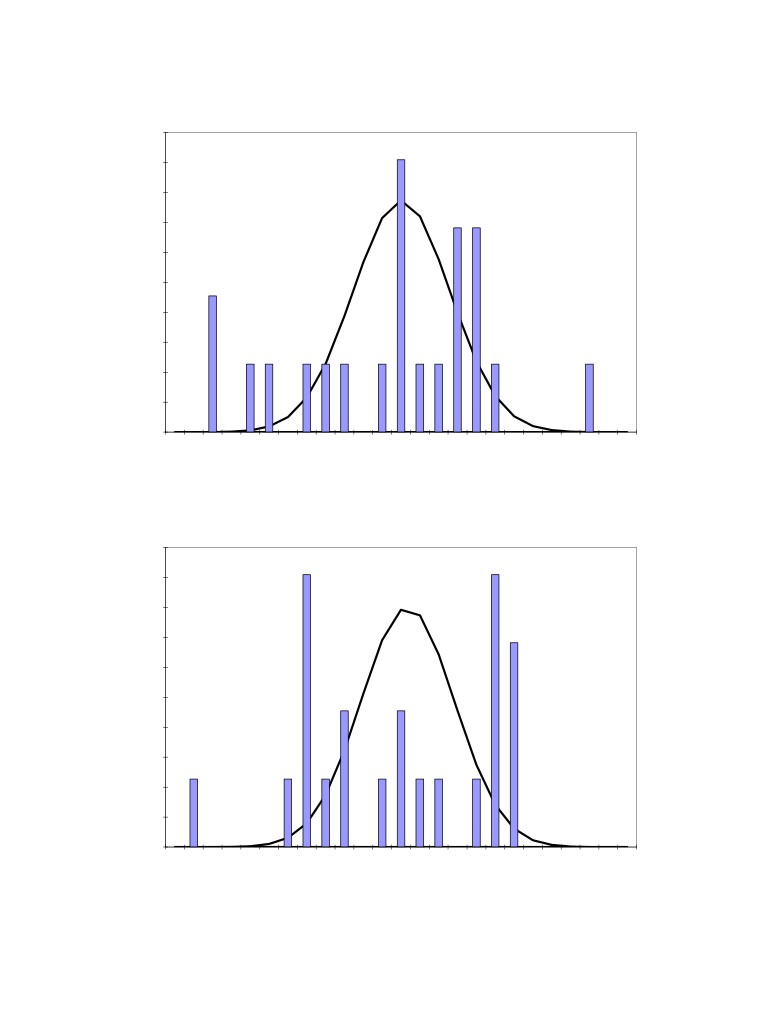
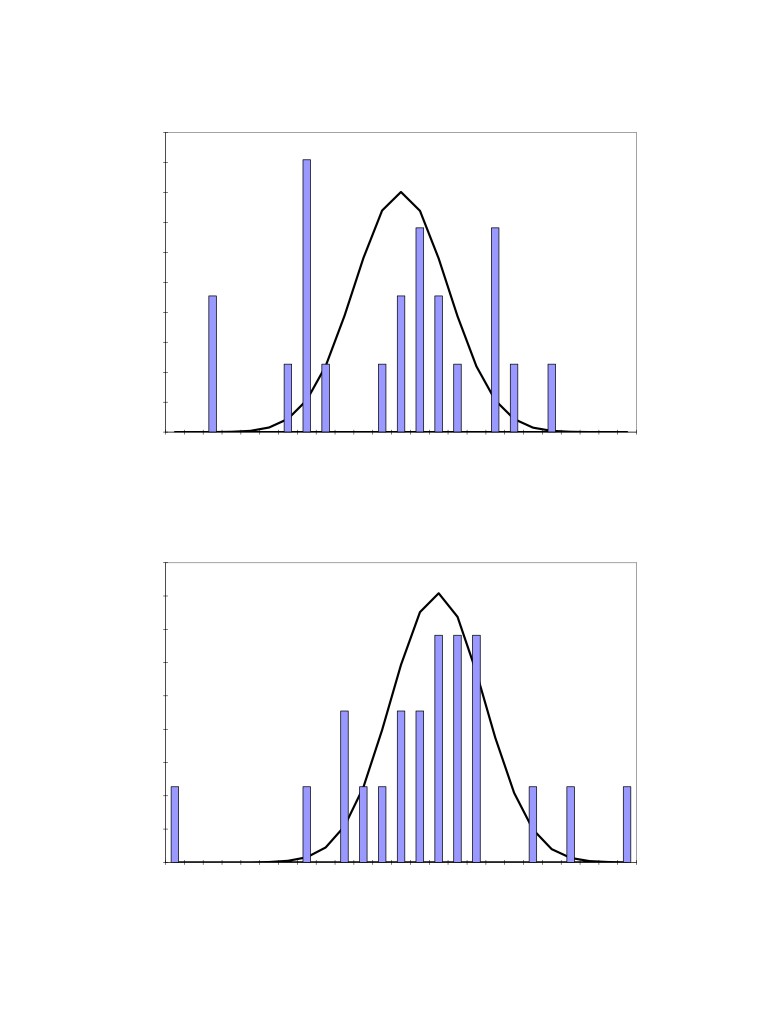
The obtained results are presented in Table 2. Figures
5 to 8 present the corresponding
distributions. As we can see, Figures 5 to 8 are very similar to Figures 1 to 4 again highlighting
the lack of homogeneity of the bath. The tapping hole seems to be as good a location as
anywhere else to take bath samples. Again the averaged results give a very consistent picture of
the cell conditions as the average measured excess AlF3 concentration of 11.04%, the average
measured dissolved alumina concentration of 3.1%, the line average CaF2 concentration of 4.9%
and the measured average bath temperature of 971.18 °C can be used to calculate a bath
superheat of
11.88 °C using the Solheim equation [3] while the measured average bath
superheat is 11.56 °C.
Yet, it is clear that the non homogeneity of the bath creates a sampling noise problem that has
never been addressed. That bath sampling noise could easily be identified by STARprobeTM
measurements. But on its own, replacing standard bath sampling by STARprobeTM
measurements at the same frequency, even if extra information is obtained and that information
is known without delay, is not addressing the fact that the measured information is noisy. One
way to address that sampling noise problem is to measure more frequently and to apply some
kind of filter on the measured data before taking feedback control action on it, but discussing
this was not in the scope of the present paper.
Position
Excess
Al2O3
Temp
Super
tap
11.28
3.7
965.91
12.43
tap
11.39
3.61
968.02
12.23
tap
11.08
3.24
968.83
14.98
tap
10.81
3.65
968.59
13.53
tap
11.06
3.4
968.82
13.55
tap
11.19
3.92
969.65
16.66
side
10.98
3.32
973.66
18.25
tap
11.43
3.09
970.89
11.65
side
10.38
3.14
973.92
9.64
tap
10.51
2.16
972.09
2.69
tap
11.06
2.51
971.22
8.64
side
10.37
2.69
973.77
7.54
tap
11.12
2.72
971.63
9.91
side
11.3
3.13
974.09
12.52
tap
10.59
3.45
969.7
12.92
side
11.06
2.16
973.93
8.59
side
11.28
2.7
974.31
11.47
tap
10.71
3.71
968.89
11.84
side
11.35
2.7
974.36
11.02
tap
10.88
3.23
971.26
12.78
side
11.34
2.7
973.14
10.83
tap
11.75
3.26
969.2
10.68
Mean
11.04181818
3.099545455
971.1763636
11.56136
Std Dev
0.361091419
0.497637057
2.493080988
3.20755
Table 2: Raw data from the second repetitivity test
5
0.2
0.18
0.16
0.14
0.12
0.1
0.08
0.06
0.04
0.02
0
10.3 10.3 10.4 10.5 10.6 10.6 10.7 10.8 10.8 10.9
11
11
11.1 11.2 11.3 11.3 11.4 11.5 11.5 11.6 11.7 11.7 11.8 11.9
12
Measured excess AlF3 concentration %
Figure 5: Distribution of the 22 measured excess AlF3 concentration
0.2
0.18
0.16
0.14
0.12
0.1
0.08
0.06
0.04
0.02
0
965
966
967
967
968
968
969
969
970
970
971
971
972
972
973
973
974
974
975
975
976
976
977
977
978
Measued bath temperature °C
Figure 6: Distribution of the 22 measured bath temperature
6
0.2
0.18
0.16
0.14
0.12
0.1
0.08
0.06
0.04
0.02
0
2
2.1
2.2
2.3
2.4
2.5
2.6
2.7
2.8
2.9
3
3.1
3.2
3.3
3.4
3.5
3.6
3.7
3.8
3.9
4
4.1
4.2
4.3
4.4
Measured dissolved alumina concentration %
Figure 7: Distribution of the 22 measured dissolved alumina concentration
0.18
0.16
0.14
0.12
0.1
0.08
0.06
0.04
0.02
0
2.6
3.8
4.45
5.1
5.75
6.4
7.05
7.7
8.35
9
9.65
10.3
11
11.6 12.3 12.9 13.6 14.2 14.9 15.5 16.2 16.8 17.5 18.1 18.8
Measued bath superheat °C
Figure 8: Distribution of the 22 measured bath superheat
7
3.
Second measurement campaign
The second measurement campaign was carried out in another smelter operated by another
aluminium producer in order to demonstrate the STARprobeTM technology. So the aim of that
very short measurement campaign was to quickly verify that the STARprobeTM can replace the
bath sampling/XRD lab analysis of the excess AlF3 concentration and can measure the bath
superheat as well as the other commercial method available. Figure 9 presents the results
obtained for the parallel measurement of the excess AlF3 in 2 different cells so in addition of the
comparison between the
2 methods, the issue of the lack of strict repetitivity of the
measurements can also be observed in both methods of analysis.
It is important to notice that the default STARprobeTM calibration parameters have been used in
that measurement campaign, per example, the average CaF2 concentration of the cells in that
smelter did not match, so the STARprobeTM measured excess AlF3 concentration is slightly
offset for that reason. The next step would have been to carry out a STARprobeTM calibration
exercise in order to eliminate the offset between the STARprobeTM and the XRD calculation of
the excess AlF3 concentration, but that would have required more time than was available in that
short demonstration measurement campaign. That STARprobeTM calibration exercise has been
successfully carried out in a third measurement campaign not presented here.
Figure 10 presents the results obtained for the parallel measurement of the bath superheat in 2
different cells. Again enough measurements have been taken to highlight the lack of strict
repetitivity of the measurements regardless of the method used.
There were no attempts to try to compare the STARprobeTM measurement of the dissolved
alumina concentration with another method in that second measurement campaign.
12
11.5
|-------------- cell #2 ---------------|
11
|-------------- cell #1 ---------------|
XRD
StarProbe
10.5
10
9.5
11:45:36
12:00:00
12:14:24
12:28:48
12:43:12
12:57:36
13:12:00
Time
Figure 9: Measured excess AlF3 concentration
8
14.00
12.00
10.00
Other
method
8.00
StarProbe
|-------------- cell #1 ---------------|
|-------------- cell #2 ---------------|
6.00
4.00
2.00
11:45:36
12:00:00
12:14:24
12:28:48
12:43:12
12:57:36
13:12:00
Time
Figure 10: Measured bath superheat
4.
Conclusions
Familiarization and demonstration STARprobeTM measurement campaigns have been
successfully carried out by STAS since January 2012 in different smelters around the world.
Some results from two of them have been presented here.
Comparison with other methods have been carried out independently of Alcoa and are
confirming Alcoa’s claims on the capabilities of the STARprobeTM to get instantaneous
measurement of bath properties for feedback process control purposes.
Measurement repetitivity tests highlight the relative variability or lack of strict repetitivity of the
measurements which in turn highlight the lack of homogeneity of the bath. This is particularly
true for the dissolved alumina concentration and the bath superheat which is directly affected by
the dissolved alumina concentration in the bath sample.
One way to address that sampling noise problem is to measure more frequently and to apply
some kind of filter on the measured data before taking feedback control action on it, but that
discussion was not in the scope of the present paper.
9
5.
References
1.
Wang, X., Hosler, B. and Tarcy, G. Alcoa STARprobeTM, Light Metals, (2011), pp 483-
489
2.
Wang, X., Tarcy, G., Batista, E. and Wood, G. Active pot control using Alcoa
STARprobeTM, Light Metals, (2011), pp 491-496
3.
Solhein, A., Rolseth, S., Skybakmoen, E. and Stoen, L. Liquidus temperature and
alumina solubility in the system Na3AlF6-AlF3-Lif-CaF2-MgF2, Light Metals, (1995),
pp 451-460
10